VBA講義 - Ch09. 補充講義
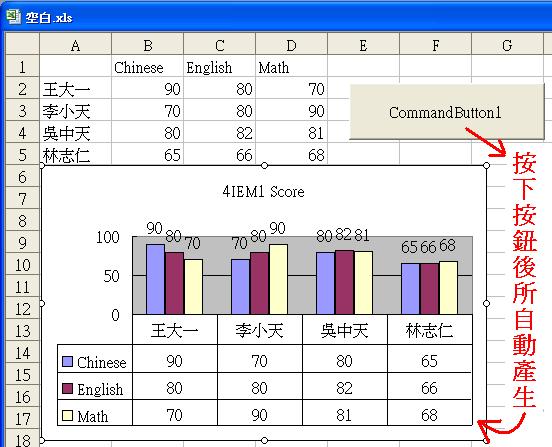
1. 設計一個程式來把"學生的成績"產生"圖表", 如下圖
雙按圖中的命令鈕寫下以下的程式
Set myrange = Range("A1:D5")
Charts.Add
ActiveChart.SetSourceData Source:=myrange, PlotBy:=xlColumns
ActiveChart.ChartType = xlColumnClustered
'ActiveChart.Location where:=xlLocationAsObject,
Name:="Sheet3"
'ActiveChart.HasTitle = True
'ActiveChart.ChartTitle.Text = "4IEM1 Score"
'ActiveChart.HasLegend = False
'ActiveChart.HasDataTable = True
'ActiveChart.ApplyDataLabels Type:=xlDataLabelsShowValue