Case 1: Dense Gaussian Networkstwo D2
Case 2: Dense Gaussian Networkstwo Dk, while odd k >=3
Case 3: Dense Gaussian Networkstwo Dk, while even k >=4
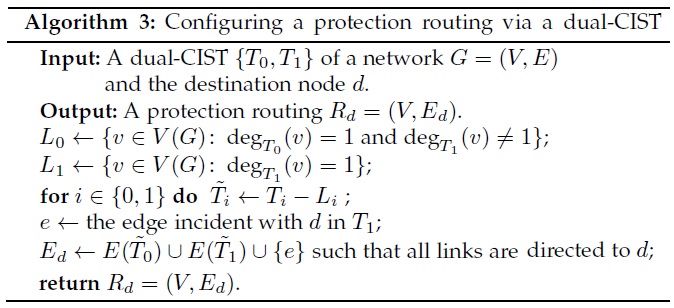
The following are graphical illustrations of protection routing in dense Gaussian networks D2.
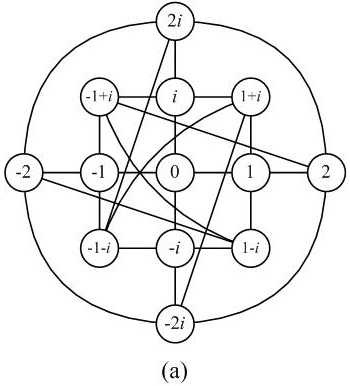
Fig. (a) The dense Gaussian network D2
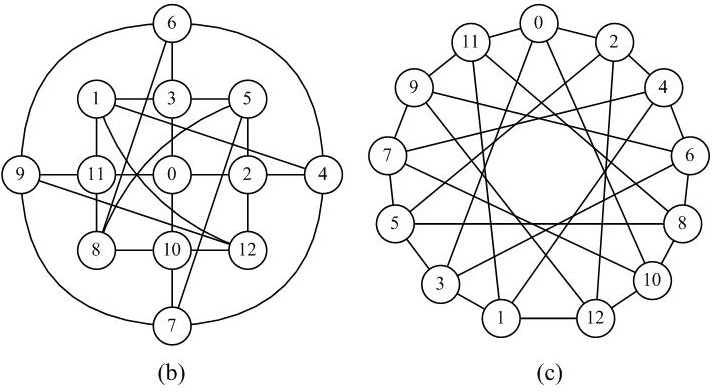
Fig. (b) The dense Gaussian network D2 (the labels of vertices are mapped on Z_13)
Fig. (c) The circulant graph C_13(2, 3) (which is isomorphic to D2)
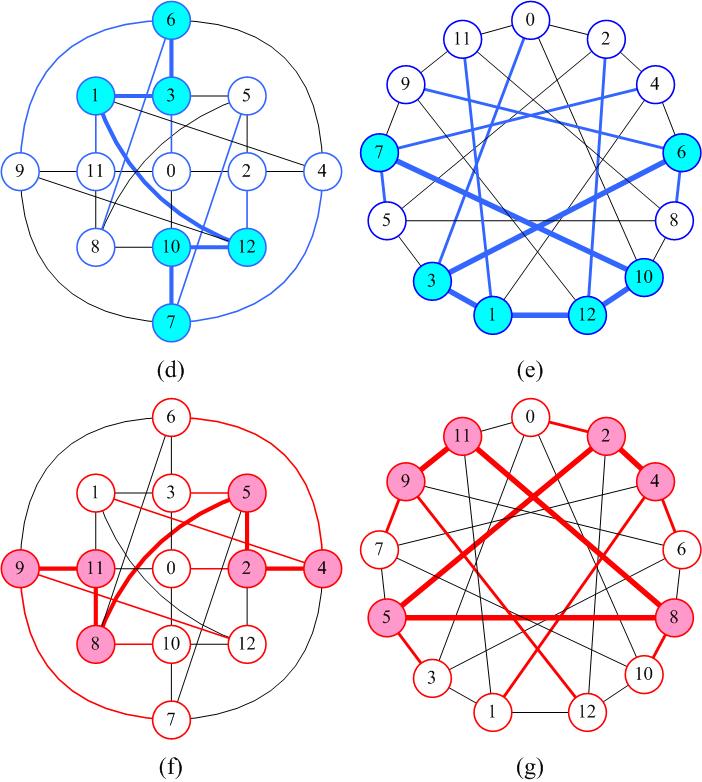
Fig. (d) The blue lines indicate the first CIST T_0 in D2
Fig. (e) The blue lines indicate the first CIST T_0 in C_13(2, 3)
Fig. (f) The red lines indicate the second CIST T_1 in D2
Fig. (g) The red lines indicate the second CIST T_1 in C_13(2, 3)
|
The Protection Routing Algorithm (from [42])
[42] J. Tapolcai, Sfficient conditions for protection routing in IP networks, Optim. Lett., vol.7, no.4, pp.723-730, 2013. |
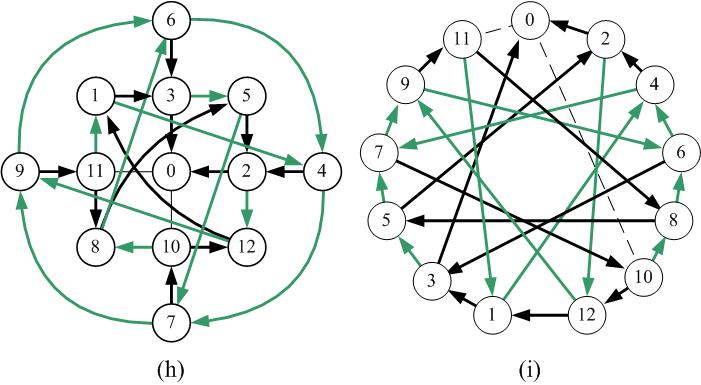
Fig. (h) The example of the protection routing of D2 with the destination node 0 (y <-- x: y is the primary next-hop of x,
z <-- x: z is the second next-hop of x)
Fig. (i) The example of the protection routing of C_13(2, 3) with the destination node 0 (y <-- x: y is the primary next-hop of x,
z <-- x: z is the second next-hop of x)
1. In the dense Gaussian network D2, D3, ..., D12
2. Randomly generate 4,000,000 instances of node pairs (source s, destination d) and s != d
3. For each instances, calculate the path length of (s, d) under
(i) no faulty node
(ii) 1 ~ 10 faulty nodes
4. Calculate three statistical quantities: the average path length (Avg.), the standard deviation of path length (Std), and the maximum path
length and the number of its occurrences (Max.)
5. Calculate RSNH (the ratio of invoking the second next-hop) and TFR (transmission failure rate)
Simulation results:
Table 1. Average path lengths
| Number of faulty nodes |
|||||||||||
| Networks | 0 | 1 | 2 | 3 | 4 | 5 | 6 | 7 | 8 | 9 | 10 |
| D2 | 2.85 | 2.94 | 2.79 | 2.58 | 2.35 | 2.13 | 1.91 | 1.7 | 1.5 | 1.31 | 1.14 |
| D3 | 4.83 | 5.07 | 4.92 | 4.68 | 4.43 | 4.17 | 3.91 | 3.64 | 3.38 | 3.13 | 2.89 |
| D4 | 7.38 | 7.69 | 7.53 | 7.22 | 6.89 | 6.55 | 6.21 | 5.89 | 5.56 | 5.26 | 4.96 |
| D5 | 10.83 | 11.29 | 11.07 | 10.65 | 10.21 | 9.78 | 9.39 | 9.02 | 8.69 | 8.36 | 8.03 |
| D6 | 14.7 | 15.23 | 14.93 | 14.42 | 13.87 | 13.3 | 12.74 | 12.21 | 11.7 | 11.21 | 10.74 |
| D7 | 19.5 | 20.16 | 19.79 | 19.13 | 18.42 | 17.7 | 17.01 | 16.37 | 15.8 | 15.29 | 14.79 |
| D8 | 24.71 | 25.47 | 25.01 | 24.27 | 23.49 | 22.68 | 21.86 | 21.07 | 20.29 | 19.55 | 18.83 |
| D9 | 30.84 | 31.69 | 31.15 | 30.24 | 29.21 | 28.17 | 27.11 | 26.11 | 25.18 | 24.34 | 23.58 |
| D10 | 37.39 | 38.34 | 37.69 | 36.75 | 35.76 | 34.74 | 33.69 | 32.63 | 31.55 | 30.52 | 29.51 |
| D11 | 44.85 | 45.86 | 45.11 | 44.0 | 42.71 | 41.25 | 39.76 | 38.38 | 37.01 | 35.8 | 34.69 |
| D12 | 52.73 | 53.87 | 52.99 | 51.87 | 50.69 | 49.46 | 48.16 | 46.86 | 45.52 | 44.18 | 42.89 |
| Number of faulty nodes |
|||||||||||
| Networks | 0 | 1 | 2 | 3 | 4 | 5 | 6 | 7 | 8 | 9 | 10 |
| D2 | 1.34 | 1.57 | 1.52 | 1.37 | 1.14 | 1.04 | 0.79 | 0.61 | 0.5 | 0.28 | 0.0 |
| D3 | 2.84 | 3.25 | 3.16 | 3.0 | 2.83 | 2.69 | 2.49 | 2.29 | 2.12 | 1.98 | 1.78 |
| D4 | 4.62 | 5.19 | 5.15 | 4.94 | 4.72 | 4.49 | 4.27 | 4.05 | 3.82 | 3.64 | 3.41 |
| D5 | 7.11 | 7.89 | 7.81 | 7.53 | 7.21 | 6.92 | 6.64 | 6.41 | 6.18 | 5.97 | 5.77 |
| D6 | 9.83 | 10.85 | 10.7 | 10.36 | 9.99 | 9.62 | 9.25 | 8.9 | 8.56 | 8.23 | 7.91 |
| D7 | 13.25 | 14.45 | 14.26 | 13.84 | 13.37 | 12.87 | 12.4 | 11.96 | 11.54 | 11.18 | 10.84 |
| D8 | 16.93 | 18.45 | 18.11 | 17.58 | 17.1 | 16.59 | 16.09 | 15.6 | 15.1 | 14.61 | 14.15 |
| D9 | 21.26 | 22.89 | 22.56 | 22.0 | 21.37 | 20.69 | 19.99 | 19.29 | 18.63 | 18.01 | 17.47 |
| D10 | 25.9 | 27.88 | 27.32 | 26.63 | 25.99 | 25.39 | 24.81 | 24.19 | 23.56 | 22.94 | 22.3 |
| D11 | 31.16 | 33.23 | 32.69 | 32.01 | 31.24 | 30.36 | 29.42 | 28.49 | 27.51 | 26.66 | 25.83 |
| D12 | 36.76 | 39.26 | 38.42 | 37.54 | 36.76 | 36.09 | 35.39 | 34.66 | 33.9 | 33.14 | 32.41 |
| Number of faulty nodes |
|||||||||||
| Networks | 0 | 1 | 2 | 3 | 4 | 5 | 6 | 7 | 8 | 9 | 10 |
| D2 | 6 | 9 | 9 | 9 | 8 | 7 | 6 | 5 | 4 | 3 | 2 |
| D3 | 13 | 20 | 22 | 21 | 20 | 19 | 18 | 17 | 16 | 15 | 14 |
| D4 | 20 | 35 | 35 | 35 | 34 | 33 | 31 | 31 | 29 | 28 | 28 |
| D5 | 31 | 50 | 52 | 54 | 54 | 51 | 49 | 49 | 45 | 45 | 43 |
| D6 | 42 | 77 | 76 | 74 | 73 | 72 | 68 | 67 | 66 | 62 | 60 |
| D7 | 57 | 98 | 100 | 100 | 98 | 98 | 92 | 91 | 87 | 86 | 84 |
| D8 | 72 | 135 | 132 | 130 | 128 | 127 | 122 | 113 | 113 | 103 | 105 |
| D9 | 91 | 162 | 164 | 163 | 160 | 161 | 152 | 147 | 141 | 136 | 132 |
| D10 | 110 | 208 | 208 | 201 | 199 | 191 | 193 | 175 | 183 | 172 | 165 |
| D11 | 133 | 242 | 243 | 249 | 237 | 227 | 222 | 212 | 213 | 205 | 211 |
| D12 | 156 | 297 | 293 | 290 | 284 | 267 | 256 | 271 | 244 | 246 | 232 |
| Number of faulty nodes |
|||||||||||
| Networks | 0 | 1 | 2 | 3 | 4 | 5 | 6 | 7 | 8 | 9 | 10 |
| D2 | 0 | 16.81 | 30.07 | 40.7 | 49.21 | 55.94 | 61.48 | 65.91 | 69.65 | 72.73 | 75.39 |
| D3 | 0 | 16.7 | 29.5 | 39.54 | 47.48 | 53.82 | 59.02 | 63.29 | 66.85 | 69.84 | 72.39 |
| D4 | 0 | 16.35 | 28.92 | 38.73 | 46.45 | 52.72 | 57.74 | 62.01 | 65.44 | 68.42 | 70.97 |
| D5 | 0 | 16.7 | 29.33 | 39.1 | 46.75 | 52.87 | 57.81 | 61.92 | 65.38 | 68.31 | 70.75 |
| D6 | 0 | 16.5 | 29.05 | 38.72 | 46.32 | 52.38 | 57.35 | 61.42 | 64.88 | 67.75 | 70.21 |
| D7 | 0 | 16.63 | 29.29 | 38.91 | 46.51 | 52.55 | 57.46 | 61.54 | 64.93 | 67.84 | 70.24 |
| D8 | 0 | 16.61 | 29.08 | 38.73 | 46.33 | 52.34 | 57.28 | 61.27 | 64.66 | 67.53 | 69.99 |
| D9 | 0 | 16.65 | 29.24 | 38.87 | 46.37 | 52.48 | 57.36 | 61.37 | 64.75 | 67.66 | 70.06 |
| D10 | 0 | 16.62 | 29.15 | 38.72 | 46.3 | 52.33 | 57.2 | 61.28 | 64.63 | 67.46 | 69.89 |
| D11 | 0 | 16.68 | 29.23 | 38.86 | 46.4 | 52.37 | 57.2 | 61.28 | 64.61 | 67.5 | 69.96 |
| D12 | 0 | 16.63 | 29.09 | 38.74 | 46.25 | 52.27 | 57.16 | 61.18 | 64.52 | 67.39 | 69.87 |
| Number of faulty nodes |
|||||||||||
| Networks | 0 | 1 | 2 | 3 | 4 | 5 | 6 | 7 | 8 | 9 | 10 |
| D2 | 0 | 0 | 6.12 | 14.21 | 22.75 | 31.19 | 39.43 | 46.98 | 53.9 | 59.9 | 65.01 |
| D3 | 0 | 0 | 5.04 | 11.23 | 17.64 | 24.07 | 30.36 | 36.41 | 42.16 | 47.46 | 52.32 |
| D4 | 0 | 0 | 3.79 | 8.9 | 14.34 | 19.88 | 25.22 | 30.42 | 35.35 | 40.04 | 44.37 |
| D5 | 0 | 0 | 3.69 | 8.4 | 13.18 | 17.74 | 22.05 | 26.22 | 30.1 | 33.9 | 37.49 |
| D6 | 0 | 0 | 3.12 | 7.22 | 11.6 | 16.06 | 20.38 | 24.57 | 28.57 | 32.35 | 35.93 |
| D7 | 0 | 0 | 3.03 | 7.02 | 11.23 | 15.33 | 19.21 | 22.75 | 26.13 | 29.22 | 32.11 |
| D8 | 0 | 0 | 2.59 | 6.01 | 9.72 | 13.5 | 17.32 | 20.95 | 24.56 | 27.94 | 31.19 |
| D9 | 0 | 0 | 2.57 | 6.06 | 9.81 | 13.62 | 17.31 | 20.7 | 23.89 | 26.81 | 29.45 |
| D10 | 0 | 0 | 2.2 | 5.07 | 8.24 | 11.55 | 14.93 | 18.27 | 21.55 | 24.71 | 27.75 |
| D11 | 0 | 0 | 2.23 | 5.32 | 8.74 | 12.25 | 15.72 | 19.06 | 22.1 | 24.88 | 27.54 |
| D12 | 0 | 0 | 1.9 | 4.36 | 7.1 | 10.03 | 13.07 | 16.07 | 19.05 | 22.05 | 24.92 |