Back to the first page.
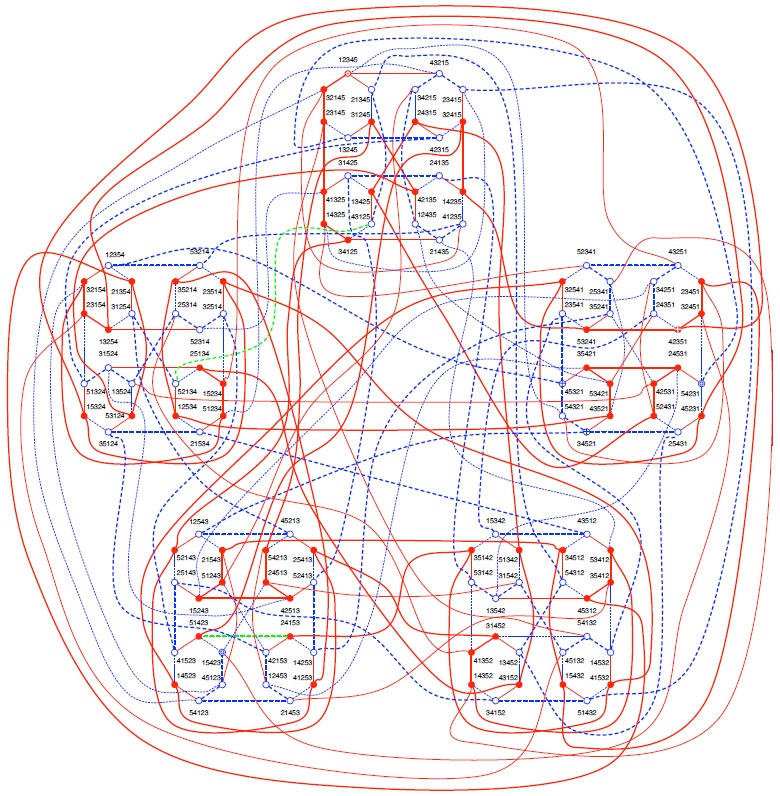
Show two CISTs of 5-D pancake graph (P_5) (The recommended resolution is higher than 1440 * 900.)
Red lines: CIST1
Blue lines: CIST2
Red vertices: V1 of s CIST-partition
Blue vertices: V2 of s CIST-partition
Thick lines: the skeleton of CIST1 (or CIST2)
Dashed lines: no used
(a) CIST_1 (b) CIST_2